
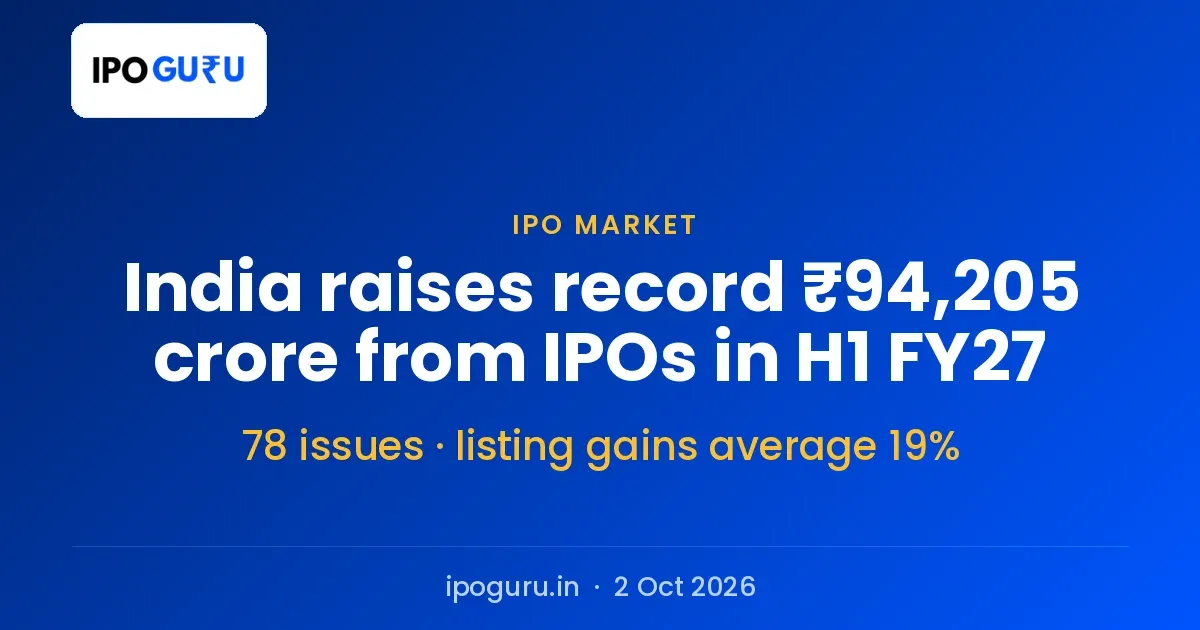
Mainboard IPO fundraising H1 FY27 added up to ₹94,205 crore, the most Indian companies have ever raised through IPOs in the first half of a financial year. 78 companies came to the market between April and September 2026. That is 35 per cent more than the previous record of ₹69,533 crore raised by 65 IPOs in the same six months last year, according to a PRIME Database report dated 1 October 2026.
The headline number is only half the story. Almost all of it was raised in the last three months.
The record was built after June
Only ₹3,794 crore came in during the first three months of the financial year, as PRIME Database's Pranav Haldea pointed out in the report. By arithmetic, that leaves about ₹90,411 crore raised between July and September 2026. Nearly 96 per cent of a record half year landed in one quarter.
Haldea's words on the first quarter were blunt. The record happened "despite an extremely slow start to the year, with only Rs 3,794 crore being raised in the first three months and also despite volatile secondary markets through most part of the six months".
If you started applying to IPOs this year and felt the calendar went from empty to crowded, that is because it did.
How the half compares with last year
| Measure | H1 FY27 | H1 FY26 |
|---|---|---|
| Money raised, mainboard IPOs | ₹94,205 crore | ₹69,533 crore |
| Number of mainboard IPOs | 78 | 65 |
| Average listing gain | 19 per cent | 7 per cent |
| Average retail applications per IPO | 17.71 lakh | 12.69 lakh |
| Average retail oversubscription | 29 times | 23 times |
| IPO money including SME issues | About ₹1 lakh crore | ₹76,330 crore |
Counting everything companies raised from the public equity market, not just IPOs, the figure was ₹2.43 lakh crore, up 75 per cent. That total includes SME IPOs, follow-on placements and REIT and InvIT issues. Fresh capital, the part that goes to the company rather than to selling shareholders, was ₹1.14 lakh crore, or 47 per cent of it.
Listing gains doubled, and a quarter of the issues are still below issue price
The average listing gain of the 64 IPOs that had listed by the end of September was 19 per cent, against 7 per cent a year earlier. Average is a kind word, though. 46 of those 64, or 72 per cent, were trading above their issue price. The other 18 were not.
So in the strongest first half on record, roughly one IPO in four is still under water for anyone who held on. That is the part a record fundraising figure does not tell you. Our own mainboard listing performance table shows the same split issue by issue, with the listing price and the price since.
Listing gain is measured against the issue price on listing day only. The grey market premium quoted before an IPO lists is a different thing: an unofficial price between dealers, which we publish with a timestamp on our live IPO GMP page and which has been wrong in both directions this year.
Retail applied in much bigger numbers
The average mainboard IPO drew 17.71 lakh retail applications, up from 12.69 lakh a year earlier. Retail demand averaged 29 times the retail quota, against 23 times.
Demand was concentrated at the top. 42 of the 64 issues with response data, about two in three, were subscribed more than 10 times overall. 25 crossed 50 times.
A high overall subscription changes what retail applicants actually get. In the retail category, allotment is by lot through a computerised draw once demand crosses the quota, so at 29 times demand most single lot applications come back empty. One PAN, one application: extra applications from the same PAN are rejected.
Three issues brought in 44 per cent of the money
The half year was top heavy. The three largest IPOs were:
- NSE, ₹22,563 crore
- SBI Funds Management, ₹9,795 crore
- Manipal Health Enterprises, ₹9,275 crore
Those three add up to ₹41,633 crore, about 44 per cent of the ₹94,205 crore total. The remaining 75 issues shared the rest.
What happens next
The queue is longer than what has already gone through. 145 companies hold a SEBI approval and are waiting to launch issues worth about ₹2.78 lakh crore. Another 102 companies, looking to raise about ₹1.87 lakh crore, have filed and are waiting for SEBI to clear them.
A SEBI approval is valid for 12 months, so a company that has one must launch within that window or file again. That is what makes the approved pile a usable guide to the next two or three quarters, and why the second half of FY27 has the material to beat the first. Whether it does depends on the secondary market, because companies postpone when the index wobbles. We track every filing and approval on the upcoming mainboard IPO page, updated as SEBI publishes its weekly processing status.
The next set of half year numbers from PRIME Database is due in early April 2027.
Frequently asked questions
How much did Indian IPOs raise in H1 FY27?
Mainboard IPOs raised ₹94,205 crore between April and September 2026, across 78 issues. Counting SME IPOs as well, companies raised about ₹1 lakh crore through IPOs in those six months.
What was the average IPO listing gain in H1 FY27?
It was 19 per cent across the 64 IPOs that had listed by 30 September 2026, against 7 per cent in the same six months of FY26. Of those 64 issues, 46 were trading above their issue price and 18 below it.