

IPO Guru
Bajaj
Closed Mainboard

Jio Platforms IPO

Jio Platforms IPO — date, price band, lot size & details 2026

Jio Platforms listed on 28 Oct 2026 at ₹1,358, 21.4% above the ₹1,119 issue price.

Jio Platforms is the digital arm of Reliance Industries, and its subsidiary Reliance Jio Infocomm served 524.4 million customers in India as of 31 March 2026. Revenue from operations grew from Rs 109,558.10 crore in FY2024 to Rs 146,885.30 crore in FY2026.

Stock price

Jio Platforms is listed — here is the live share price.

Loading market data…
Abhishek Vohera, Founder of IPO Guru Researched & reviewed by Abhishek Vohera, Founder, IPO Guru Last updated Figures sourced from the RHP, BSE & NSE

Timetable

Key dates from opening to listing. Today is 22 November.

Key dates Listed
  1. Open 21 Oct 2026
  2. Close 23 Oct 2026
  3. Allotment 26 Oct 2026
  4. Refund/credit 27 Oct 2026
  5. Listing 28 Oct 2026

Latest news

Our news coverage of Jio Platforms, newest first.

All IPO news →

Watch

Jio Platforms in under a minute, from IPO Guru.

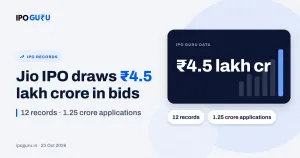
YouTube Short · IPO Guru Jio IPO Broke This 7 Records 23 Oct 2026 Watch on YouTube →
YouTube Short · IPO Guru JIO IPO Allotment Chances 20 Oct 2026 Watch on YouTube →
More on our YouTube channel →

Issue summary

The terms of the offer, as filed.

IPO Dates 21 to 23 Oct, 2026
Price Band ₹1065 – ₹1119
Face Value ₹10
Lot Size 12 Shares
Issue Size ₹30187.65 Cr
Sale Type Fresh capital only
Listing On BSE, NSE
Employee Discount Rs 54.00 per share
Registrar KFin Technologies Limited
Min Investment ₹ 13,428
Reservation
QIB 44.99%
NII 13.5%
Retail 31.5%
Employee 1.74%
Shareholder 8.27%

Share of the offer set aside for each investor category, as stated in the offer document.

What will it cost me?

Bidding is in multiples of 12 shares at the ₹1119 cut-off. Drag to size your application.

shares
1 lot lots
If it lists at today's grey market premium of ₹247
on
Grey market premium is an unofficial, unregulated indicator. It is not a forecast.
Application Lots Shares Amount
Retail (min) 1 12 ₹13,428
Retail (max) 14 168 ₹1,87,992
S-HNI (min) 15 180 ₹2,01,420
S-HNI (max) 74 888 ₹9,93,672
B-HNI (min) 75 900 ₹10,07,100

Strengths & risks

Drawn from the offer document — the case for and against, side by side.

Strengths · 8

  • 01Revenue from operations grew from Rs 109,558.10 crore in FY2024 to Rs 128,218.40 crore in FY2025 and Rs 146,885.30 crore in FY2026.
  • 02The EBITDA margin was 51.91% in FY2026, up from 50.05% in FY2025 and 50.16% in FY2024.
  • 03Profit after tax grew from Rs 21,434.00 crore in FY2024 to Rs 30,052.70 crore in FY2026, at a PAT margin of 19.82%.
  • 04RJIL's customer base reached 524.4 million as of 31 March 2026, with 36.2 million net additions in FY2026 against 6.4 million in FY2025.
  • 05Average revenue per user for the exit quarter rose from Rs 181.7 per month in FY2024 to Rs 214.0 in FY2026.
  • 06Data traffic grew from 148.5 billion GBs in FY2024 to 241.4 billion GBs in FY2026, and monthly data use per customer rose from 28.7 GB to 42.3 GB.
  • 07Net cash generated from operating activities was Rs 77,556.30 crore in FY2026 against a profit after tax of Rs 30,052.70 crore.
  • 08Net leverage fell from 0.88 times in FY2024 to 0.36 times in FY2026, and EBITDA less cash capex rose from Rs 1,449.10 crore to Rs 42,071.10 crore over the same two years.

Risks · 10

  • 01Total fund based outstanding borrowings of the company and its subsidiaries were Rs 71,529.20 crore as of 31 March 2026, and the capital intensive nature of the business needs continued access to funding for technology upgrades and capital expenditure.
  • 02RJIL holds the telecommunication licences and spectrum that the business runs on. Any inability to maintain or renew them, or to win spectrum in future auctions, would hit operations.
  • 03Monthly churn for the exit quarter was 1.67% in FY2026 against 1.52% in FY2024, and a sustained rise in churn would hurt the customer base of 524.4 million.
  • 04Return on average capital employed fell from 12.83% in FY2024 to 12.50% in FY2025 and 10.76% in FY2026, even as revenue grew.
  • 05The company does not control the use of the Jio trademark by other companies in the Reliance Group, so negative publicity from outside the company can affect its brand.
  • 06The company and its subsidiaries have non-exclusive agreements with the promoter, Reliance Retail Limited and other Reliance Group entities for key parts of the business.
  • 07The company depends on a limited group of passive infrastructure providers for a substantial part of its telecommunication towers and optic fibre network.
  • 08Litigation against the subsidiaries covers 18 criminal, 200 tax and 26 statutory or regulatory proceedings involving Rs 10,811.00 crore. Of this, GST input tax credit disputes worth Rs 6,766.70 crore have not been recognised as a contingent liability in the restated financial information.
  • 09Proceedings against the promoter Reliance Industries Limited involve Rs 40,310.60 crore and US$ 4.13 billion, and include two disciplinary actions by SEBI or the stock exchanges in the last five years and four material civil litigations.
  • 10The whole fresh issue of up to 27,00,00,000 equity shares goes to prepaying borrowings of RJIL and to general corporate purposes, and the offer document does not split the amount between the two uses.

Three years of numbers

All figures in ₹ crore, as reported in the Jio Platforms offer document.

Total income
146,885.30
128,218
146,885
--
31 Mar 202531 Mar 202630 Jun 2026
Profit after tax
7,764.10
26,120
30,053
7,764
31 Mar 202531 Mar 202630 Jun 2026
EBITDA
20,864.50
64,170
76,255
20,865
31 Mar 202531 Mar 202630 Jun 2026
Borrowing vs net worth
61,372.20 / 341,778.50
31 Mar 202531 Mar 202630 Jun 2026
Borrowing Net worth
Metric 30 Jun 2026 31 Mar 2026 31 Mar 2025 31 Mar 2024
Revenue from Operations 146885.30 128218.40 109558.10
Assets 6,22,905.30 6,15,594.00 5,81,233.80 5,39,580.40
Total Income 40,197.90 1,49,759.10 1,29,333.00 1,10,175.40
Profit After Tax 7,764.10 30,052.70 26,120.30 21,434.00
EBITDA 20,864.50 76,255.40 64,170.00 54,958.70
NET Worth 3,41,778.50 3,34,013.40 3,04,022.40 2,77,866.10
Reserves and Surplus 3,32,839.50 3,25,074.40 2,95,083.40 2,68,927.10
Total Borrowing 61,372.20 70,781.00 73,060.30 54,348.90

See how this IPO compares — view listing performance of all mainboard IPOs.

Valuation & key ratios

Ratios are for the latest full financial year reported in the Jio Platforms RHP. EPS and P/E are post-issue — the table below carries the pre-issue comparison.

P/E Ratio
33.19
EPS (₹)
33.72
RoNW
2.30%
PAT Margin
19.82%
EBITDA Margin
53.26%
NAV (₹)
382.34

Jio Platforms IPO Valuation

How the issue prices the company before and after the fresh shares are created.

Valuation Metric Pre-Issue Post-Issue
EPS (₹) ₹33.62 ₹33.72
P/E Ratio (x) 33.28 33.19
Market Cap at Offer Price (₹ Cr) ₹258,418.44 ₹1,030,490.55

Pre-issue figures use the shareholding reported in the RHP; post-issue figures use the shareholding once the fresh issue has created new shares. The two differ because of that dilution and because post-issue earnings per share are often annualised, so the change can run in either direction. Market capitalisation is calculated at the ₹1119 offer price. Compare the post-issue P/E against listed peers before deciding — a premium there is growth you are paying for in advance.

Where the money goes

How the company intends to use the proceeds of the issue.

Prepayment, in full or in part, of certain outstanding borrowings of the material subsidiary Reliance Jio Infocomm Limited Not stated
General corporate purposes Not stated

Jio Platforms IPO Anchor Investors

212 anchor investors across 83 fund houses committed ₹8,109.86 Cr a day before the issue opened.

Anchor Investor Fund House Shares Amount (₹ Cr) % of Anchor Book
Life Insurance Corp.of India Life Insurance Corp.of India 4,468,128 499.98 6.17%
BNP Paribas Financial Markets-Odi BNP Paribas 2,710,020 303.25 3.74%
Blackrock Global Funds-Emerging Markets Fund Blackrock 332,016 37.15 0.46%
Blackrock Global Funds-India Fund Blackrock 210,384 23.54 0.29%
Blackrock Global Funds-Emerging Markets Ex-China Fund Blackrock 168,696 18.88 0.23%
Blackrock Global Funds-Emerging Markets Sustainable Equity Fund Blackrock 140,580 15.73 0.19%
Blackrock Emerging Markets Fund Blackrock 127,068 14.22 0.18%
Blackrock Global Funds-Emerging Markets Equity Income Fund Blackrock 109,260 12.23 0.15%
New World Fund,Inc. New World Fund 4,345,548 486.27 6.00%
Eupac Fund Capital Group 1,397,568 156.39 1.93%
Capital Group Eupac Common Trust (Us) Capital Group 212,928 23.83 0.29%
American Funds Developing World Growth & Income Fund American Funds 195,048 21.83 0.27%
Capital Group New World Trust (Us) Capital Group 122,832 13.74 0.17%
American Funds Insurance Series-New World Fund American Funds Insurance Series 115,632 12.94 0.16%
Capital Group New Geography Equity Etf Capital Group 89,424 10.01 0.12%
Fidelity Contrafund: Fidelity Contrafund Fidelity 1,099,392 123.02 1.52%
Fidelity Securities Fund: Fidelity Blue Chip Growth Fund Fidelity 631,404 70.65 0.87%
Fidelity Group Trust For Employee Benefit Plans: Fidelity Contrafund Commingled Pool Fidelity 403,404 45.14 0.56%
Fidelity Puritan Trust: Fidelity Balanced Fund Fidelity 261,300 29.24 0.36%
Fidelity Select Portfolios: Technology Portfolio Fidelity 234,900 26.29 0.32%
Fidelity Contrafund: Fidelity Contrafund K6 Fidelity 230,004 25.74 0.32%
Fidelity Investment Trust: Fidelity Series Emerging Markets Opportunities Fund Fidelity 191,100 21.38 0.26%
Fidelity Securities Fund: Fidelity Blue Chip Growth K6 Fund Fidelity 134,100 15.01 0.19%
Fidelity Group Trust For Employee Benefit Plans: Fidelity Blue Chip Growth Commingled Pool Fidelity 111,504 12.48 0.15%
Fidelity Advisor Series I: Fidelity Advisor Series Equity Growth Fund Fidelity 102,900 11.51 0.14%
Fiam Group Trust For Employee Benefit Plans: Fiam Target Date Blue Chip Growth Commingled Pool Fidelity 66,000 7.39 0.09%
Fidelity Investment Trust: Fidelity Emerging Markets Fund Fidelity 64,296 7.19 0.09%
Fiam Group Trust For Employee Benefit Plans: Fiam Emerging Markets Opportunities Commingled Pool Fidelity 57,900 6.48 0.08%
Fidelity Rutland Square Trust Ii: Strategic Advisers Fidelity Emerging Markets Fund As Managed By Fiam Llc Fidelity 55,728 6.24 0.08%
Fidelity Investment Trust: Fidelity Diversified International Fund Fidelity 55,200 6.18 0.08%
Fidelity Group Trust For Employee Benefit Plans: Fidelity Diversified International Commingled Pool Fidelity 51,396 5.75 0.07%
Fidelity Investment Trust: Fidelity Series Emerging Markets Fund Fidelity 47,496 5.31 0.07%
Government Of Singapore Government Of Singapore 3,046,728 340.93 4.20%
Monetary Authority Of Singapore Monetary Authority Of Singapore 751,296 84.07 1.04%
HDFC Flexi Cap Fund HDFC Mutual Fund 1,183,476 132.43 1.63%
HDFC Large Cap Fund HDFC Mutual Fund 1,128,972 126.33 1.56%
HDFC Balanced Advantage Fund HDFC Mutual Fund 474,948 53.15 0.66%
HDFC Children's Fund HDFC Mutual Fund 233,580 26.14 0.32%
HDFC Retirement Savings Fund-Equity Plan HDFC Mutual Fund 233,580 26.14 0.32%
HDFC Innovation Fund HDFC Mutual Fund 210,228 23.52 0.29%
HDFC Business Cycle Fund HDFC Mutual Fund 179,076 20.04 0.25%
HDFC Retirement Savings Fund-Hybrid Equity Plan HDFC Mutual Fund 116,796 13.07 0.16%
HDFC Consumption Fund HDFC Mutual Fund 31,140 3.48 0.04%
HDFC Hybrid Debt Fund HDFC Mutual Fund 6,228 0.70 0.01%
ICICI Prudential Equity & Debt Fund ICICI Prudential Mutual Fund 786,420 88.00 1.09%
ICICI Prudential Balanced Advantage Fund ICICI Prudential Mutual Fund 732,792 82.00 1.01%
ICICI Prudential Multi-Asset Fund ICICI Prudential Mutual Fund 732,792 82.00 1.01%
ICICI Prudential Value Fund ICICI Prudential Mutual Fund 732,792 82.00 1.01%
ICICI Prudential Large Cap Fund ICICI Prudential Mutual Fund 366,396 41.00 0.51%
ICICI Prudential Business Cycle Fund ICICI Prudential Mutual Fund 223,416 25.00 0.31%
ICICI Prudential ELSS Tax Saver Fund ICICI Prudential Mutual Fund 223,416 25.00 0.31%
SBI Focused Fund SBI Mutual Fund 2,815,020 315.00 3.88%
SBI Infrastructure Fund SBI Mutual Fund 268,092 30.00 0.37%
SBI Technology Opportunities Fund SBI Mutual Fund 268,092 30.00 0.37%
SBI Consumption Opportunities Fund SBI Mutual Fund 268,092 30.00 0.37%
Magnum Hybrid Long Short Fund SBI Mutual Fund 178,728 20.00 0.25%
Aditya Birla Sun Life Flexi Cap Fund Aditya Birla Sun Life Mutual Fund 848,964 95.00 1.17%
Aditya Birla Sun Life Large Cap Fund Aditya Birla Sun Life Mutual Fund 804,288 90.00 1.11%
Aditya Birla Sun Life Digital India Fund Aditya Birla Sun Life Mutual Fund 357,456 40.00 0.49%
Aditya Birla Sun Life ELSS Tax Saver Fund Aditya Birla Sun Life Mutual Fund 259,164 29.00 0.36%
Aditya Birla Sun Life Equity Hybrid '95 Fund Aditya Birla Sun Life Mutual Fund 169,800 19.00 0.23%
Aditya Birla Sun Life Multi-Cap Fund Aditya Birla Sun Life Mutual Fund 151,920 17.00 0.21%
Aditya Birla Sun Life Consumption Fund Aditya Birla Sun Life Mutual Fund 89,364 10.00 0.12%
Schroder International Selection Fund-Emerging Markets Schroder 633,828 70.93 0.87%
Hartford Schroders Emerging Markets Equity Fund Hartford 624,084 69.83 0.86%
Schroder International Selection Fund-Emerging Asia Schroder 440,796 49.33 0.61%
California State Teachers Retirement System-Schroder Investment Management North America,Inc. California State Teachers Retirement System 219,708 24.59 0.30%
Public Sector Pension Investment Board- Schroder Investment Management North America Inc. Public Sector Pension Investment Board 138,636 15.51 0.19%
Fidelity Rutland Square Trust Ii: Strategic Advisers Emerging Markets Fund As Managed By Schroder Investment Management North America Inc. Fidelity 134,256 15.02 0.19%
Schroder Global Emerging Markets Fund Schroder 95,508 10.69 0.13%
Schroder Emerging Markets Fund, A Separate Investment Fund Within The Schroder Capital Management Collective Trust Schroder 87,600 9.80 0.12%
Schroder International Selection Fund-Bic (Brazil, India, China) Schroder 73,752 8.25 0.10%
Schroder International Selection Fund-Sustainable Asian Equity Schroder 63,360 7.09 0.09%
Schroder International Selection Fund-Indian Equity Schroder 55,104 6.17 0.08%
Schroder International Opportunities Portfolio-Schroder Asia More(Plus) Schroder 50,964 5.70 0.07%
Kotak Multicap Fund Kotak Mahindra Mutual Fund 402,132 45.00 0.55%
Kotak Infrastructure & Economic Reform Fund Kotak Mahindra Mutual Fund 357,456 40.00 0.49%
Kotak ELSS Tax Saver Fund Kotak Mahindra Mutual Fund 330,648 37.00 0.46%
Kotak Balanced Advantage Fund Kotak Mahindra Mutual Fund 268,092 30.00 0.37%
Kotak Contra Fund Kotak Mahindra Mutual Fund 178,728 20.00 0.25%
Kotak Rural Opportunities Fund Kotak Mahindra Mutual Fund 160,848 18.00 0.22%
Infinity Hybrid Long-Short Fund Kotak Mahindra Mutual Fund 89,400 10.00 0.12%
Ninety One Emerging Markets Equity Fund Ninety One 918,912 102.83 1.27%
Ninety One Global Select Llc-Ninety One Emerging Markets Equity Fund Ninety One 503,784 56.37 0.70%
Hostplus Pooled Superannuation Trust Investec 4Factor Hostplus 166,140 18.59 0.23%
Florida Retirement System-Ninety One North America,Inc. Florida Retirement System 102,324 11.45 0.14%
Internationale Kapitalanlagegesellschaft Mbh Acting For Account Of Entsorgungsfonds Internationale Kapitalanla Gmbh 96,144 10.76 0.13%
Nippon India Multi Cap Fund Nippon India Mutual Fund 893,652 100.00 1.23%
Nippon India Large Cap Fund Nippon India Mutual Fund 893,652 100.00 1.23%
Jp Morgan Funds J.p.morgan 981,972 109.88 1.35%
Jp Morgan Sar Asian Fund J.p.morgan 474,780 53.13 0.66%
Mgts Afh Da Asia Ex Japan Equity Fund Managed By Jp Morgan Asset Management Ltd. Mgts Afh Da 67,884 7.60 0.09%
Jp Morgan Fund Icvc-Jpm Asia Pacific Equity Fund J.p.morgan 60,384 6.76 0.08%
Jp Morgan Investment Funds J.p.morgan 44,688 5.00 0.06%
ABU Dhabi Investment Authority-Monsoon ABU Dhabi Investment 1,340,472 150.00 1.85%
Allianz Global Investors Global Emerging Markets Fund Allianz 425,544 47.62 0.59%
Allianz Global Investors Fund-Allianz Total Return Asian Equity Allianz 323,412 36.19 0.45%
Allianz Global Investors Fund-Allianz India Equity Allianz 255,324 28.57 0.35%
Allianz Global Investors Fund-Allianz Emerging Markets Equity Opportunities Allianz 144,684 16.19 0.20%
Allianz Emerging Markets Equity Fund Allianz 102,132 11.43 0.14%
Allianz Total Return Asian Equity Fund Allianz 89,376 10.00 0.12%
Df International Partners Ii,Llc Df International Partners 1,340,472 150.00 1.85%
Inq Holding Llc Inq Holding 1,340,472 150.00 1.85%
ABU Dhabi Investment Authority-Stable ABU Dhabi Investment 804,276 90.00 1.11%
360 One Private Equity Fund-Series Ii 360 One 89,376 10.00 0.12%
Franklin India ELSS Tax Saver Fund Franklin Templeton Mutual Fund 335,124 37.50 0.46%
Franklin India Multi Cap Fund Franklin Templeton Mutual Fund 279,264 31.25 0.39%
Franklin India Small Cap Fund Franklin Templeton Mutual Fund 279,264 31.25 0.39%
HDFC Life Insurance Co.ltd. HDFC Life Insurance 893,652 100.00 1.23%
HDFC Nps Trust-HDFC Pension Management Co.ltd.-Scheme E-Tier I HDFC Nps Trust 714,936 80.00 0.99%
HDFC Nps Trust-HDFC Pension Management Co.ltd.-Scheme E-Tier Ii HDFC Nps Trust 80,424 9.00 0.11%
HDFC Nps Trust-HDFC Pf Nps Equity Advantage Fund-Tier I HDFC Nps Trust 71,484 8.00 0.10%
HDFC Nps Trust-HDFC Pension Management Co.ltd.-Nps Vatsalya Scheme HDFC Nps Trust 26,808 3.00 0.04%
Mirae Asset Large Cap Fund Mirae Asset Mutual Fund 714,924 80.00 0.99%
Mirae Asset Aggressive Hybrid Fund Mirae Asset Mutual Fund 178,728 20.00 0.25%
Redwheel Emerging Markets Equity Master Fund Ltd. Redwheel 489,276 54.75 0.68%
Redwheel Funds-Redwheel Global Emerging Markets Fund Redwheel 315,000 35.25 0.43%
Redwheel Global Emerging Equity Fund Redwheel 89,376 10.00 0.12%
SBI Life Insurance Co.ltd. SBI Life Insurance 893,652 100.00 1.23%
SBI Nps Trust-SBI Pension Fund Scheme-E Tier I SBI Nps Trust 670,236 75.00 0.92%
SBI Nps Trust-SBI Pension Fund Scheme-Central Govt. SBI Nps Trust 223,416 25.00 0.31%
Whiteoak Capital Flexi Cap Fund Whiteoak Capital Mutual Fund 420,012 47.00 0.58%
Whiteoak Capital Multi Cap Fund Whiteoak Capital Mutual Fund 107,244 12.00 0.15%
Whiteoak Capital Large & Mid Cap Fund Whiteoak Capital Mutual Fund 98,304 11.00 0.14%
Whiteoak Capital Digital Bharat Fund Whiteoak Capital Mutual Fund 89,364 10.00 0.12%
Whiteoak Capital Large Cap Fund Whiteoak Capital Mutual Fund 80,424 9.00 0.11%
Whiteoak Capital Balanced Advantage Fund Whiteoak Capital Mutual Fund 40,212 4.50 0.06%
Whiteoak Capital Aggressive Hybrid Fund Whiteoak Capital Mutual Fund 22,344 2.50 0.03%
Whiteoak Capital ELSS Tax Saver Fund Whiteoak Capital Mutual Fund 20,112 2.25 0.03%
Whiteoak Capital Balanced Hybrid Fund Whiteoak Capital Mutual Fund 13,404 1.50 0.02%
Whiteoak Capital Equity Savings Fund Whiteoak Capital Mutual Fund 2,232 0.25 0.00%
Axis Max Life Insurance Ltd.-Ulif 00125/06/04 Lifegrowth104-Growth Fund Axis Max Life Insurance 268,116 30.00 0.37%
Axis Max Life Insurance Ltd.-Sustainable Equity Fund-Ulif02505/10/21 Sustainequ104 Axis Max Life Insurance 62,544 7.00 0.09%
Axis Max Life Insurance Ltd.-Ulif 00225/06/04 Lifebalanc 104-Balanced Fund Axis Max Life Insurance 62,544 7.00 0.09%
Axis Max Life Insurance Ltd. Axis Max Life Insurance 53,616 6.00 0.07%
Axis Large Cap Fund Axis Mutual Fund 212,760 23.81 0.29%
Axis ELSS Tax Saver Fund Axis Mutual Fund 212,760 23.81 0.29%
Axis Multi Asset Allocation Fund Axis Mutual Fund 21,300 2.38 0.03%
Bajaj Life Insurance Ltd. Bajaj Life Insurance 446,820 50.00 0.62%
Bandhan Large & Mid Cap Fund Bandhan Mutual Fund 139,644 15.63 0.19%
Bandhan Multi Cap Fund Bandhan Mutual Fund 104,736 11.72 0.14%
Bandhan Small Cap Fund Bandhan Mutual Fund 83,772 9.37 0.12%
Bandhan Aggressive Hybrid Fund Bandhan Mutual Fund 48,024 5.37 0.07%
Bandhan Large Cap Fund Bandhan Mutual Fund 35,736 4.00 0.05%
Bandhan Value Fund Bandhan Mutual Fund 34,908 3.91 0.05%
Citigroup Global Markets Singapore Pte.ltd.-Odi Citigroup 446,820 50.00 0.62%
Canara Robeco Large Cap Fund Canara Robeco Mutual Fund 223,404 25.00 0.31%
Canara Robeco Equity Hybrid Fund Canara Robeco Mutual Fund 223,392 25.00 0.31%
Citadel Securities Singapore Pte.ltd. Citadel 446,820 50.00 0.62%
Eastspring Investments-India Consumer Equity Open Ltd. Eastspring 178,716 20.00 0.25%
Prudential Hong Kong Ltd.-Phkl Asia Pacific Active Growth Equity Portfolio-Ahapag-Eastspring Growth Equities Team Prudential 134,052 15.00 0.18%
Eastspring Investments India Equity Open Ltd. Eastspring 134,052 15.00 0.18%
Shamyak Investment Pvt.ltd. Shamyak 444,228 49.71 0.61%
Fidelity Funds-India Focus Fund Fidelity 446,820 50.00 0.62%
Hcl Capital Pvt.ltd. Hcl Capital 446,820 50.00 0.62%
Invesco India Contra Fund Invesco Mutual Fund 446,820 50.00 0.62%
Janus Henderson Fund-Emerging Markets Asia Fund Janus Henderson 253,212 28.33 0.35%
Janus Henderson Emerging Markets Fund Janus Henderson 96,840 10.84 0.13%
Janus Henderson Emerging Markets Opportunities Fund Janus Henderson 96,768 10.83 0.13%
Societe Generale-Odi Societe General 446,820 50.00 0.62%
Integrated Core Strategies (Asia) Pte.ltd. Integrated Core 446,820 50.00 0.62%
Morgan Stanley Investment Funds Indian Equity Fund Morgan Stanley 446,820 50.00 0.62%
Motilal Oswal Large Cap Fund Motilal Oswal Mutual Fund 446,820 50.00 0.62%
Government Pension Fund Global Government Pension Fund Global 446,820 50.00 0.62%
Prazim Trading & Investment Co.pvt.ltd. Prazim Trading & Investment 446,820 50.00 0.62%
Sundaram Aggressive Hybrid Fund Sundaram Mutual Fund 285,972 32.00 0.39%
Sundaram Multi Asset Allocation Fund Sundaram Mutual Fund 97,404 10.90 0.13%
Sundaram Dynamic Asset Allocation Fund Sundaram Mutual Fund 48,252 5.40 0.07%
Sundaram Equity Savings Fund Sundaram Mutual Fund 15,192 1.70 0.02%
T.rowe Price New Asia Fund T.rowe Price 446,820 50.00 0.62%
Tata Flexi Cap Fund Tata Mutual Fund 169,788 19.00 0.23%
Tata India Innovation Fund Tata Mutual Fund 98,304 11.00 0.14%
Tata Retirement Savings Fund-Progressive Plan Tata Mutual Fund 98,304 11.00 0.14%
Tata Retirement Savings Fund-Moderate Plan Tata Mutual Fund 76,404 8.55 0.11%
Tata Retirement Savings Fund-Conservative Plan Tata Mutual Fund 4,020 0.45 0.01%
UTI Value Fund UTI Mutual Fund 268,092 30.00 0.37%
UTI Large Cap Fund UTI Mutual Fund 167,556 18.75 0.23%
UTI Conservative Hybrid Fund UTI Mutual Fund 11,172 1.25 0.02%
Baroda BNP Paribas India Consumption Fund Baroda BNP Paribas Mutual Fund 133,896 14.98 0.18%
Baroda BNP Paribas Services Fund Baroda BNP Paribas Mutual Fund 89,376 10.00 0.12%
Edelweiss Large Cap Fund Edelweiss Mutual Fund 44,688 5.00 0.06%
Altiva Equity Long-Short Fund Edelweiss Mutual Fund 44,688 5.00 0.06%
Edelweiss Flexi Cap Fund Edelweiss Mutual Fund 40,140 4.49 0.06%
Edelweiss Large & Mid Cap Fund Edelweiss Mutual Fund 40,140 4.49 0.06%
Edelweiss Consumption Fund Edelweiss Mutual Fund 31,272 3.50 0.04%
Edelweiss Recently Listed Ipo Fund Edelweiss Mutual Fund 22,344 2.50 0.03%
ICICI Prudential Life Insurance Co.ltd. ICICI Prudential Life Insurance 223,272 24.98 0.31%
ICICI Nps Trust-ICICI Prudential Pension Fund Scheme E-Tier I ICICI Nps Trust 223,272 24.98 0.31%
Prudential Assurance Co.ltd.,The Prudential 223,272 24.98 0.31%
Rainmatter Capital Fund Rainmatter Capital 223,272 24.98 0.31%
Bajaj Finserv Large & Mid Cap Fund Bajaj Finserv Mutual Fund 89,376 10.00 0.12%
Bofa Securities Europe Sa-Odi Bofa Securities 89,376 10.00 0.12%
Bank Of India Flexi Cap Fund Bank Of India Mutual Fund 89,376 10.00 0.12%
Canara HSBC Life Insurance Co.ltd. Canara HSBC 89,376 10.00 0.12%
Go Digit General Insurance Ltd. Go Digit General Insurance 89,376 10.00 0.12%
Helios Large & Mid Cap Fund Helios Mutual Fund 89,376 10.00 0.12%
ICICI Lombard General Insurance Co.ltd. ICICI Lombard General Insurance 89,376 10.00 0.12%
JM Large & Midcap Fund JM Financial Mutual Fund 49,152 5.50 0.07%
JM Large Cap Fund JM Financial Mutual Fund 40,224 4.50 0.06%
Kotak Mahindra Life Insurance Co.ltd. Kotak Life Insurance 89,376 10.00 0.12%
Mahindra Manulife Consumption Fund Mahindra Manulife Mutual Fund 44,688 5.00 0.06%
Mahindra Manulife Multi Asset Allocation Fund Mahindra Manulife Mutual Fund 44,688 5.00 0.06%
Founders Collective Fund Founders Collective Fund 89,376 10.00 0.12%
Indusind Nippon Life Insurance Co.ltd. Indusind Nippon Life Insurance 89,376 10.00 0.12%
SBI General Insurance Co.ltd. SBI General Insurance 89,376 10.00 0.12%
Union Largecap Fund Union Mutual Fund 44,688 5.00 0.06%
Union Value Fund Union Mutual Fund 44,688 5.00 0.06%
UTI Nps Trust-UTI Pension Fund Scheme Atal Pension Yojana (Apy) UTI Nps Trust 78,900 8.83 0.11%
Nps Trust-Ac UTI Pension Fund Limited Scheme Apy Fund UTI Nps Trust 9,300 1.04 0.01%
UTI Nps Trust-UTI Pension Fund-Nps Vatsalya Schemе UTI Nps Trust 1,176 0.13 0.00%
Value Partners Fund Series-Value Partners Asian Income Fund Value Partners 44,685 5.00 0.06%
Value Partners High-Dividend Stocks Fund Value Partners 44,685 5.00 0.06%
Total anchor allocation 8,109.86

Anchor investors bid a day before the issue opens and are locked in after allotment, so a book weighted towards domestic mutual funds is generally read as a stronger signal than one filled by short-horizon funds. Browse every anchor investor scheme or fund house we track.

About the company

Jio Platforms Limited is a technology platform built on proprietary digital technology and pan-India digital connectivity. It sells digital connectivity and digital services to consumers and to businesses. For consumers it offers mobile and fixed broadband, digital services across entertainment, cloud gaming, cloud compute, cloud PC and storage, smart home solutions, and AI based products such as AI assistants. For businesses it offers enterprise grade broadband and leased line connectivity, cloud, productivity, unified communications, IoT, managed Wi-Fi, private 5G and security solutions, end to end managed information and communication services, and AI enterprise suite products. The material subsidiary Reliance Jio Infocomm Limited (RJIL) holds the telecom licences and served 524.4 million customers in India as of 31 March 2026. The company reports a single segment under Ind AS 108, and most of its operations are in India.

The customer base grew from 481.8 million in FY2024 to 488.2 million in FY2025 and 524.4 million in FY2026, with net customer additions of 36.2 million in FY2026 against 6.4 million in FY2025. Average revenue per user for the exit quarter rose from Rs 181.7 per month in FY2024 to Rs 206.2 in FY2025 and Rs 214.0 in FY2026. Data traffic carried on the network grew from 148.5 billion GBs in FY2024 to 184.5 billion GBs in FY2025 and 241.4 billion GBs in FY2026. Monthly data use per customer for the exit quarter rose from 28.7 GB to 33.6 GB and then 42.3 GB over the same three years. Monthly churn for the exit quarter was 1.67% in FY2026 against 1.81% in FY2025 and 1.52% in FY2024.

On the financial side, revenue from operations grew from Rs 109,558.10 crore in FY2024 to Rs 146,885.30 crore in FY2026, and profit after tax grew from Rs 21,434.00 crore to Rs 30,052.70 crore. The EBITDA margin was 50.16% in FY2024, 50.05% in FY2025 and 51.91% in FY2026. Net cash generated from operating activities was Rs 77,556.30 crore in FY2026. EBITDA less cash capex rose from Rs 1,449.10 crore in FY2024 to Rs 19,902.00 crore in FY2025 and Rs 42,071.10 crore in FY2026, and net leverage fell from 0.88 times to 0.36 times over the same period.

Reliance Industries Limited is the promoter and holds 5,937,841,645 equity shares, which is 66.43% of the pre-issue paid up equity capital. The other large shareholders are Jaadhu Holdings, LLC, an affiliate of Meta Platforms, with 9.98%, Google International LLC with 7.73%, the Public Investment Fund of Saudi Arabia with 2.31%, a KKR affiliate with 2.31%, a Vista Equity Partners affiliate with 2.31%, a Silver Lake affiliate with 1.88%, a Mubadala subsidiary with 1.85%, General Atlantic Singapore JP with 1.34%, an Abu Dhabi Investment Authority trust with 1.16% and a TPG managed entity with 0.93%. The company has 94 other shareholders, and members of the promoter group hold no equity shares. The registered office is in Ahmedabad and the corporate office is at Reliance Corporate Park, Ghansoli, Navi Mumbai.

Interested in this IPO? Check the live subscription status or browse all upcoming mainboard IPOs.

Promoters
Reliance Industries Limited
Promoter holding
66.43% → 64.48%
Pre-issue → post-issue
Registered office
Office-101, Saffron, Nr. Centre Point, Panchwati 5 Rasta, Ambawadi, Ahmedabad 380 006, Gujarat, India
+91 22 7967 0000

The bankers & the filings

Who is running the book, and the documents this page is built from.

Book-running lead manager
JM Financial Ltd. View track record →
Book-running lead manager
HSBC Securities & Capital Markets (India) Pvt. Ltd. View track record →
Book-running lead manager
SBI Capital Markets Ltd. View track record →
Book-running lead manager
Axis Capital View track record →
Book-running lead manager
ICICI Securities View track record →
Book-running lead manager
Kotak Mahindra Capital Company Limited View track record →
Book-running lead manager
Jefferies India Private Limited View track record →
Book-running lead manager
IIFL Capital Services Limited View track record →
Book-running lead manager
Bofa Securities India Limited View track record →
Book-running lead manager
Dam Capital Advisors Ltd View track record →
Book-running lead manager
HDFC Bank Limited View track record →
Book-running lead manager
Goldman Sachs (India) Securities Private Limited View track record →
Book-running lead manager
J.P. Morgan India Private Limited View track record →
Book-running lead manager
Ubs Securities India Private Limited View track record →
Red Herring Prospectus
SEBI filing
Final offer document — price band, financials and risk factors. This page is built from it.
Open the RHP
Draft RHP
SEBI filing
The draft filed ahead of approval, useful for comparing what changed.
Open the DRHP

Jio Platforms IPO Documents

Read the filings this page is built from.

Lead Manager Track Record

How the book-running lead managers on this issue have priced their past IPOs, measured on listing day.

JM Financial Ltd.

173 issues handled
Listed in Profit 73.8% 127 of 172 listed
Avg Listing Gain +19% across 172 issues
Listed Below Issue 45 of 172 listed

Best listing: Tata Technologies (+140.0%). Weakest: ACME Solar Holdings (-13.1%).

Listed in Profit 76.5% 26 of 34 listed
Avg Listing Gain +12.4% across 34 issues
Listed Below Issue 8 of 34 listed

Best listing: Gujarat State Petronet (+72.2%). Weakest: Nuvoco Vistas Corporation (-14.9%).

SBI Capital Markets Ltd.

142 issues handled
Listed in Profit 67.4% 95 of 141 listed
Avg Listing Gain +17.4% across 141 issues
Listed Below Issue 46 of 141 listed

Best listing: Bajaj Housing Finance (+114.3%). Weakest: ICICI Securities (-16.3%).

Axis Capital

257 issues handled
Listed in Profit 73.2% 186 of 254 listed
Avg Listing Gain +19.6% across 254 issues
Listed Below Issue 68 of 254 listed

Best listing: Latent View Analytics (+160.0%). Weakest: Shriram Properties (-23.7%).

ICICI Securities

222 issues handled
Listed in Profit 67.9% 150 of 221 listed
Avg Listing Gain +17.5% across 221 issues
Listed Below Issue 71 of 221 listed

Best listing: Latent View Analytics (+160.0%). Weakest: Bannari Amman Spinning Mills (-25.2%).

Listed in Profit 75.5% 154 of 204 listed
Avg Listing Gain +18.6% across 204 issues
Listed Below Issue 50 of 204 listed

Best listing: Premier Energies (+120.0%). Weakest: Puravankara Projects (-22.5%).

Listed in Profit 75% 30 of 40 listed
Avg Listing Gain +14.9% across 40 issues
Listed Below Issue 10 of 40 listed

Best listing: Nazara Technologies (+80.7%). Weakest: Turtlemint Fintech Solutions (-10.4%).

IIFL Capital Services Limited

147 issues handled
Listed in Profit 69% 100 of 145 listed
Avg Listing Gain +16.2% across 145 issues
Listed Below Issue 45 of 145 listed

Best listing: Unicommerce eSolutions (+117.6%). Weakest: ICICI Securities (-16.3%).

Bofa Securities India Limited

64 issues handled
Listed in Profit 79.7% 51 of 64 listed
Avg Listing Gain +23.4% across 64 issues
Listed Below Issue 13 of 64 listed

Best listing: Tata Technologies (+140.0%). Weakest: Puravankara Projects (-22.5%).

Dam Capital Advisors Ltd

70 issues handled
Listed in Profit 68.1% 47 of 69 listed
Avg Listing Gain +12.3% across 69 issues
Listed Below Issue 22 of 69 listed

Best listing: Go Colors (+89.9%). Weakest: Metro Brands (-12.6%).

HDFC Bank Limited

34 issues handled
Listed in Profit 73.5% 25 of 34 listed
Avg Listing Gain +17% across 34 issues
Listed Below Issue 9 of 34 listed

Best listing: G R Infraprojects (+105.0%). Weakest: Precision Camshafts (-11.3%).

Listed in Profit 68.4% 13 of 19 listed
Avg Listing Gain +17.7% across 19 issues
Listed Below Issue 6 of 19 listed

Best listing: Bajaj Housing Finance (+114.3%). Weakest: Paytm (-9.3%).

1 of their issues has listed so far, and 1 opened above the issue price (average +10.5%). That is too small a sample to read as a hit rate.

Listed in Profit 86.4% 19 of 22 listed
Avg Listing Gain +17.4% across 22 issues
Listed Below Issue 3 of 22 listed

Best listing: BGR Energy Systems (+75.0%). Weakest: Bharti Infratel (-9.1%).

Listing gain compares the listing-day opening price with the issue price, using the IPOs on IPO Guru that this lead manager has taken to market. A strong record reflects how the banker has priced past issues — it is not a forecast for this one. See every issue they have handled on the lead managers page.

Company contact

Company
Jio Platforms
Email

Frequently asked

What is the GMP of Jio Platforms?

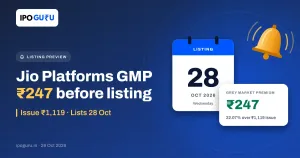
The current Grey Market Premium is ₹247, or 22.07% over the issue price.

What is the Jio Platforms IPO price band?

₹1065 to ₹1119, on a face value of ₹10.

When is the allotment?

The basis of allotment is 26 October 2026, with listing on 28 October 2026.

How do I check allotment status?

On the IPO Guru allotment page or on the registrar's site — KFin Technologies Limited.

Jio Platforms IPO

Every number here traces back to a filing.

IPO Guru tracks GMP, subscription and allotment for every Mainboard and SME issue. Every number on this page is sourced from the RHP, BSE & NSE.

Join the WhatsApp channel All mainboard IPOs

Not investment advice. Grey market premium is an unofficial, unregulated indicator and is not a forecast.


GMP
₹247
Subscribed
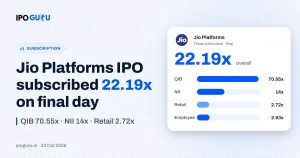
22.19×
Min bid
₹13,428
Size my application
Advertisement